I created these maps as part of analyzing the “reprecincting” the City of Brockton did as a result of the 2020 US Census.
The one-sentence take-away is that just three (3) of Brockton’s twenty-eight (28) precincts are majority white. I think most people assumed – like I did – that Brockton’s core (the “A” precincts et al) are predominantly Black and brown but that the outer edges of the city were still majority white. That’s really not the case except for the three exceptions – Brockton has rapidly become a much more diverse city in all precincts – its just a question of degree.
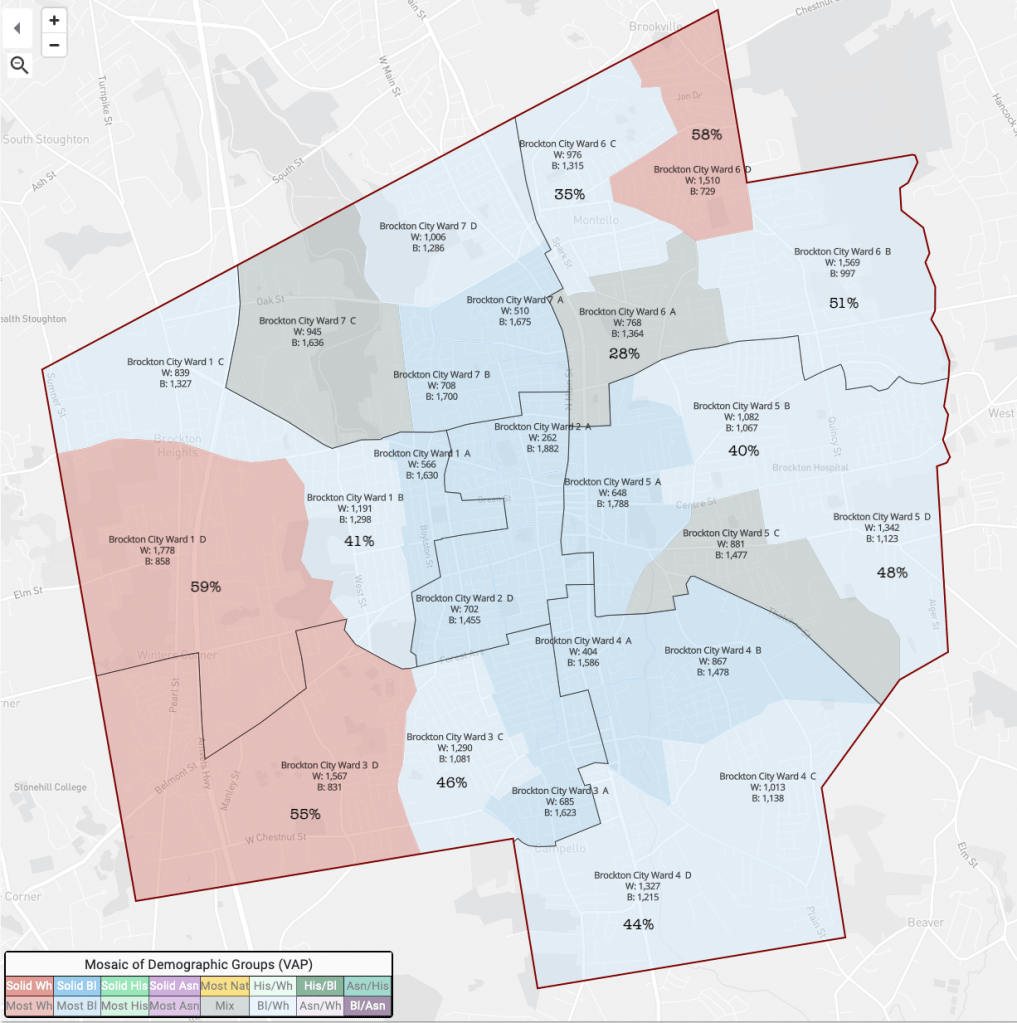
And as you can see, those three majority-white precincts (1D, 3D, 6D) aren’t even overwhelmingly white – they’re 59%, 55% and 58% respectively. Given the trends, I’d expect them to be majority people of color by the next Census.
The map also shows that the trope that Brockton is primarily poor people of color, living in tenements and apartments – is just not true. That trope gets pushed both by white racists and by non-Brocktonians of various races who peddle classism. I suppose there are well-intentioned anti-poverty advocates who also repeat that trope. But Brocktonians know that most of the city is actually suburban; the map shows that Black and brown people are part of the suburban life in numbers unseen anywhere else in Massachusetts.
This map shows the voting age population (“VAP”) with #s for white and Black adults and percentages for the white adults:
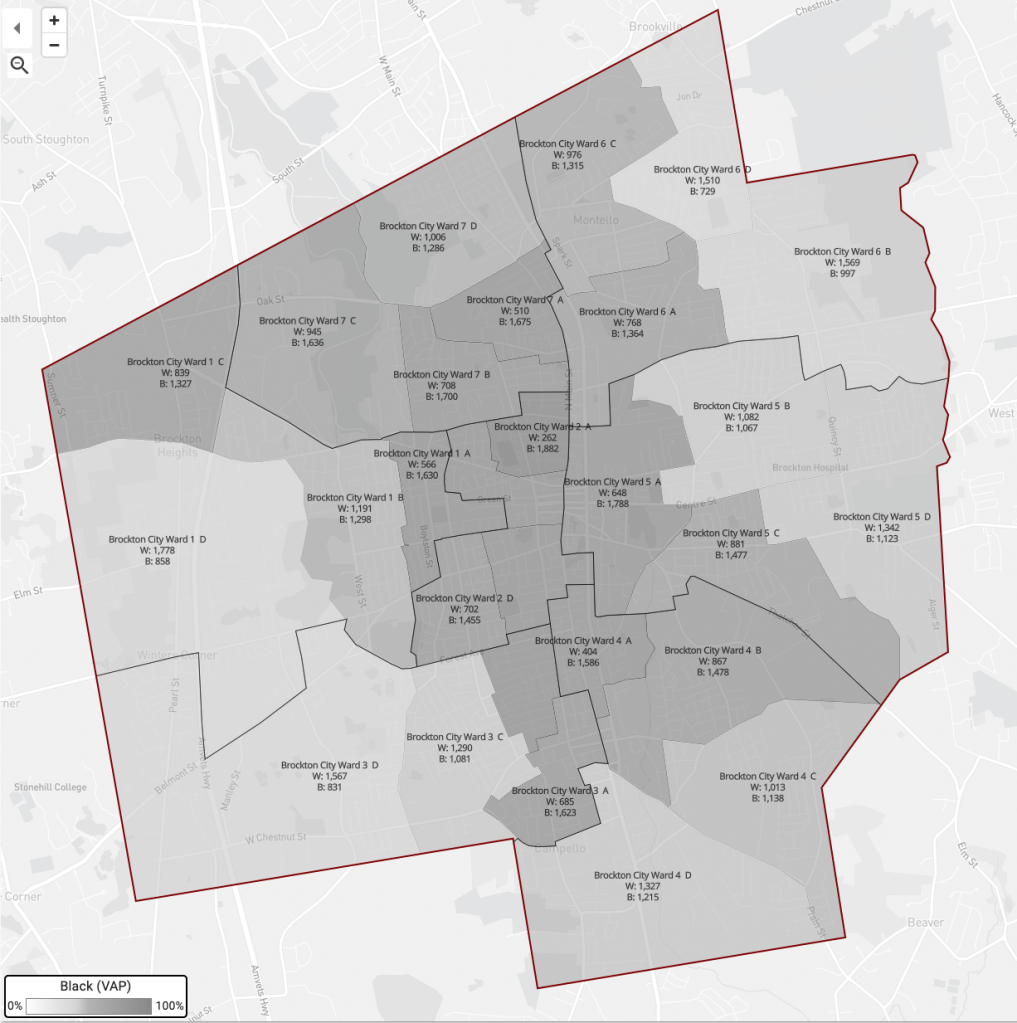
This map is shaded by the Black voting-aged population:
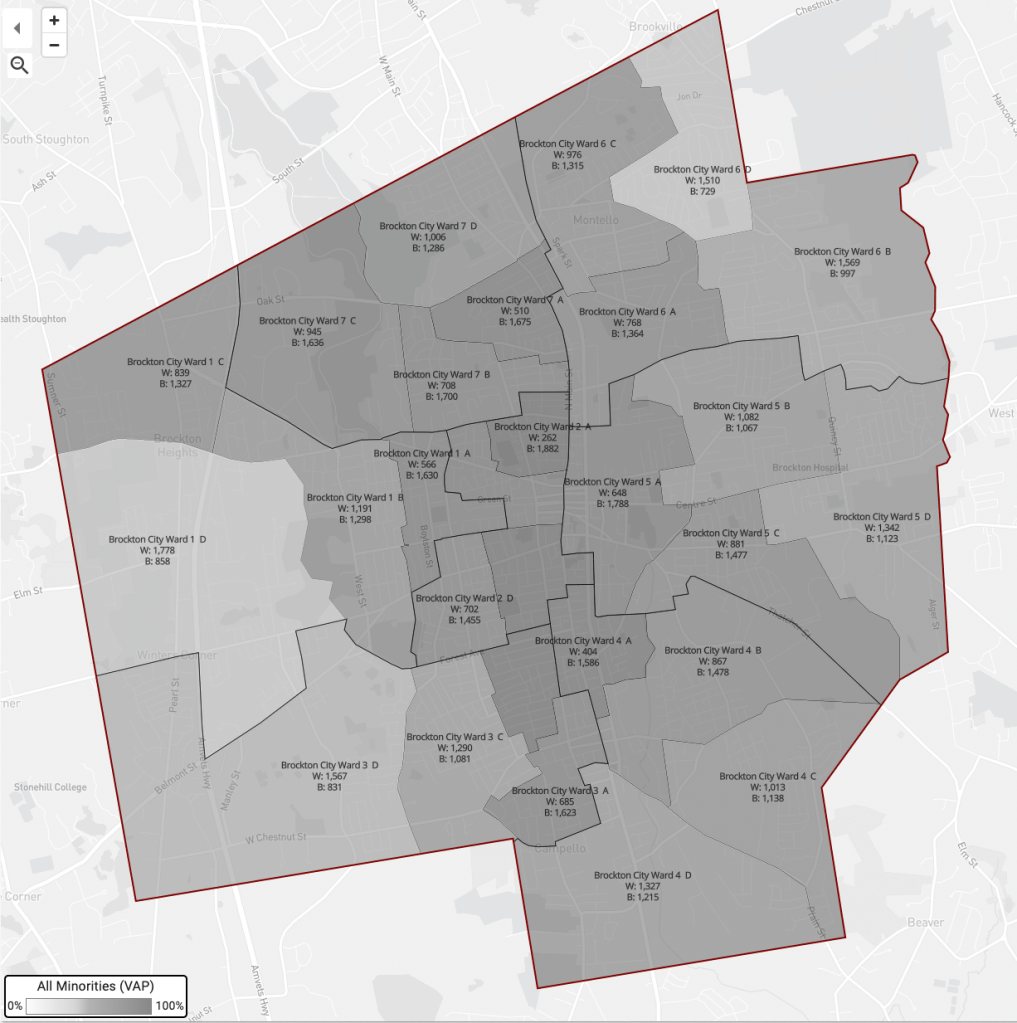
This map is shaded by “All minorities”:
And, lastly, a map showing “partisan lean” i.e. registered Democrats & Republicans:

Note, if you use these graphics elsewhere you’ll need to credit me.
